Construction Project Tracking: Master Milestone Monitoring & PM Dashboards
Concise yet insightful!
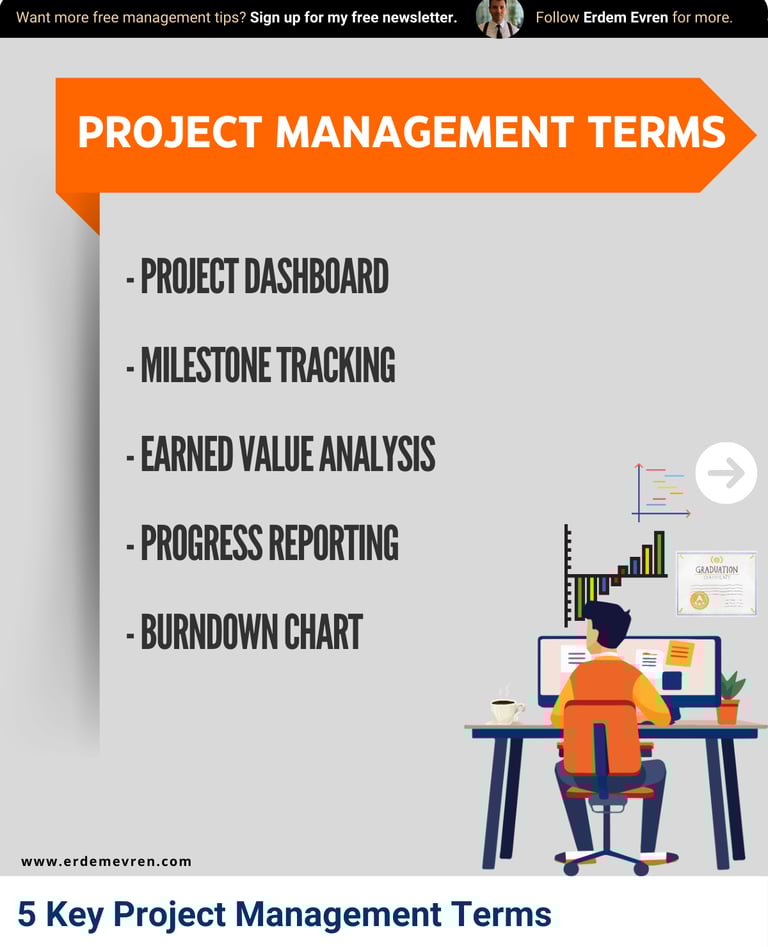
Keeping everything on track requires the right tools, strategies, and know-how. Here’s a breakdown of key project management terms:
🟩 Project Dashboard
⦿ What it is: A real-time, visual overview of your project’s key performance metrics (budget, timeline, resources).
⦿ How to use it: Use tools like Microsoft Project or Monday.com to create a dashboard that tracks critical metrics. Customize it to display cost, progress, issues, and risks so you can instantly see the status of your project.
⦿ Tip: Keep your dashboard simple and focused on essential data. Use color-coding to quickly identify areas that need attention.
🟨 Milestone Tracking
⦿ What it is: A method to track the completion of significant project stages or deliverables.
⦿ How to use it: Break your project into milestones—such as foundation complete, framing finished, or electrical inspection passed. Assign deadlines to each, and use software like Smartsheet or Primavera to monitor progress.
⦿ Tip: Align milestones with your overall project goals. Communicate these milestones with your team so everyone stays focused on the next critical task.
🟧 Earned Value Analysis (EVA)
⦿ What it is: A technique that measures project performance by comparing work completed (Earned Value) to planned work (Planned Value) and actual costs (Actual Cost).
⦿ How to use it: Track EV, PV, and AC regularly to understand if your project is on schedule and within budget. Primavera or Microsoft Project’s EVA features make this easy.
⦿ Tip: Look at the Cost Performance Index (CPI) and Schedule Performance Index (SPI) to identify trends early. A CPI or SPI below 1 indicates problems with budget or schedule that need addressing immediately.
🟪 Progress Reporting
⦿ What it is: Regular updates on project status, including completed tasks, upcoming work, and any issues or risks.
⦿ How to use it: Use Trello or Asana to automate reports based on task completion. Ensure you report progress to stakeholders consistently and include metrics that show performance.
⦿ Tip: Involve your team in regular progress updates. This not only keeps everyone aligned but also helps identify potential problems early.
🟦 Burndown Chart
⦿ What it is: A graphical representation of work remaining compared to the time left, helping you track project progress and forecast completion.
⦿ How to use it: Create a burndown chart using Excel or Jira by plotting tasks against time. This helps identify if you’re on pace to finish before deadlines.
⦿ Tip: Revisit your burndown chart daily or weekly, depending on project size. If you notice the gap between work done and time narrowing, consider reallocating resources to stay on track.